Technique Tuesday: Tracking Data Using Excel Part 2
Welcome to the second installment of Technique Tuesday: Tracking Data Using Excel! Last week we learned about conditional formatting, totals, daily average and average transaction amount. This week, Rebecca has focused on three different category totals that will be useful for tracking data and analysis.
From Rebecca Currie:
So that was how we’d been using Excel for a while, adding a little bit at a time, until 2015 when I took an Excel class as part of the Masters in Accounting (MAC) program that I was in at UNC’s Kenan-Flagler Business School. I was very excited to take that class. It did not quite meet my lofty expectations, but I did learn an extremely useful concept—I learned how to use the functions SUMIF and AVERAGEIF, which allow you to pull totals from an array of data without any further data entry.
So we added three additional sheets to the end of our workbook: All Days, Weeks, and Average. These three sheets are simply grids with functions that display data from the regular month worksheets.
The All Days sheet has 365 rows, one for every day in the year. Except in leap years when it has 366 rows. (And let me take a moment here to stamp my feet and shake my little fist and say, “Curse you, Leap Year!” It ALWAYS messes things up.)
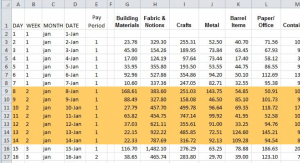
This is what All Days displays:
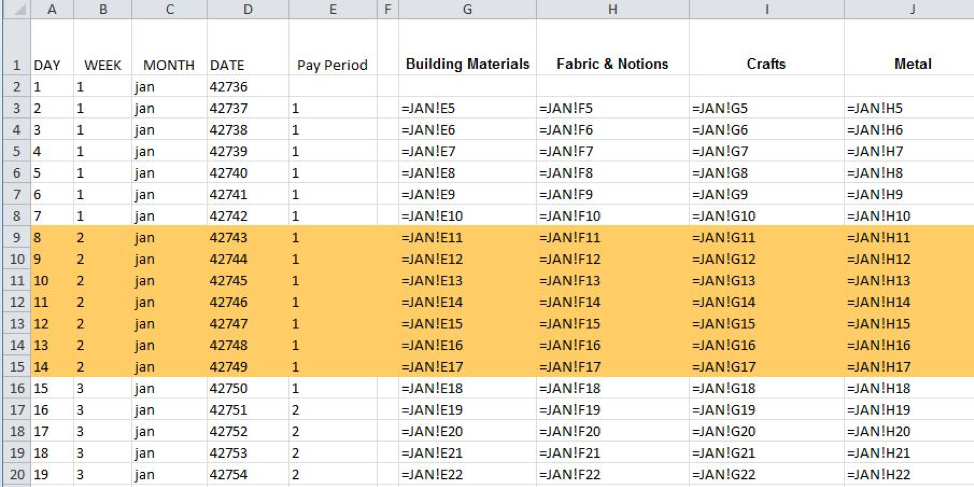
And this is what the background (CTRL-~) looks like:
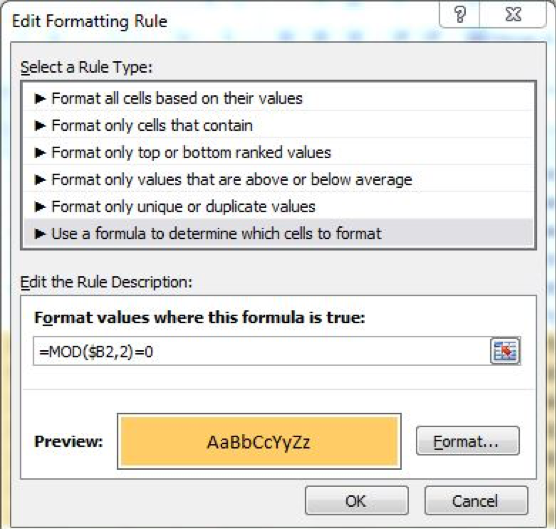
(Also note that I added conditional formatting to that so that alternate weeks are set off by bands of color. Here’s what that looks like:
The All Days sheet doesn’t do anything by itself; it works in conjunction with the Weeks tab to give us the average daily average by week for each department.
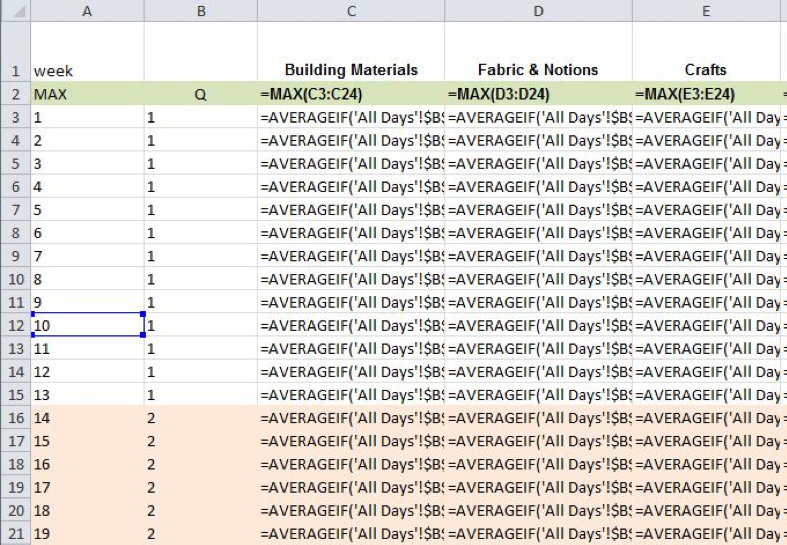
The Weeks worksheet has the same structure as the All Days worksheet, but instead of each day being a row, each week is a row; and instead of weeks being alternating bands of color, quarters are alternating bands.
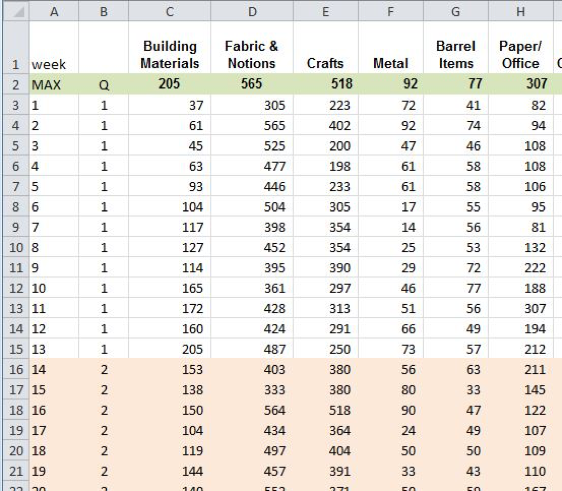
And this is what the back end looks like on that worksheet:
Stay tuned for part III coming next week!
Donate to Cascade Alliance
Cascade Alliance on LinkedIn
Cascade Alliance on Facebook
Cascade Alliance on Twitter